News
The top SaaS KPIs you need to track in 2025

As a SaaS business owner, tracking key performance indicators (KPIs) to measure your company’s success is crucial. Our investment focus in solely B2B software-as-a-service (SaaS) companies allows us to track important SaaS KPIs and access highly relevant benchmarks across our portfolio of 21 companies. Below we will take a closer look at the top SaaS KPIs that every Nordic software company should track and explain how they can help you make informed decisions about your company’s growth and profitability. We will compare numbers from 2020 to 2024.
Written by: Ingvild Farstad, Head of Operational Excellence at Viking Venture
Key SaaS metrics and KPIs
During the pandemic, SaaS companies experienced magnificent growth due to the strong lever to adopt digital technologies, low interest rates and strong purchasing power. In the last two years, sustaining the same growth has been more challenging, with several events significantly impacting the market. Tracking key SaaS metrics and KPIs to make data-driven decisions is more important than ever to overcome challenges and manage your business to its full potential. By giving each of our companies its own KPI Dashboard, they can see what is working well and what needs improvement in their business. They also see which companies are top performers and can reach out to understand what they are doing that works so well.
Benchmarks from SaaS companies at a growth stage
This article will provide you with benchmark data on how our portfolio have done from 2020 to 2024. You will gain valuable insight into how your company has performed compared to the largest community of B2B SaaS companies in the Nordics. With a focus on growth, profitability, customer acquisition cost, and sales efficiency. Viking Venture’s portfolio includes companies with an ARR ranging from 3 to 100 million EUR. Their target markets vary depending on the company size but typically they include the Nordics, UK, Benelux, DACH, and Spain—as well as the US.
Viking Venture portfolio SaaS KPI Dashboard
First, we want to give a quick reminder on the Viking Venture portfolio Dashboard for those who have not read the previous articles. The dashboard is divided into three sections to ensure we don’t discuss sub-optimal solutions.
- Growth and Profitability
- Customer Acquisition Cost and Sales Efficiency
- Coverage Model & Sales Process
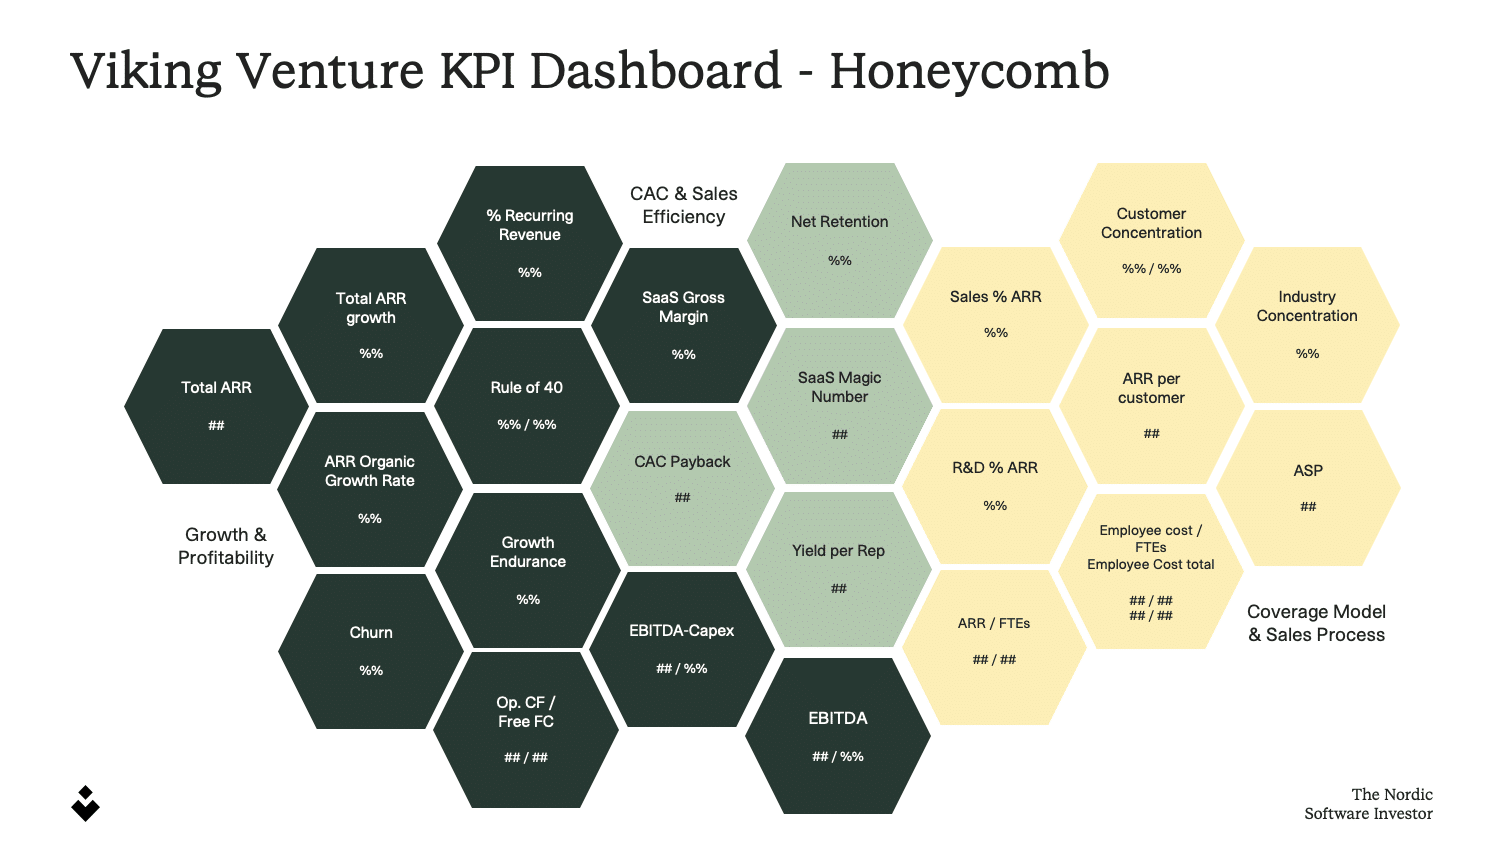
Let us take a deep dive into the Viking Venture KPI Dashboard.
1. SaaS KPIs for Growth and Profitability
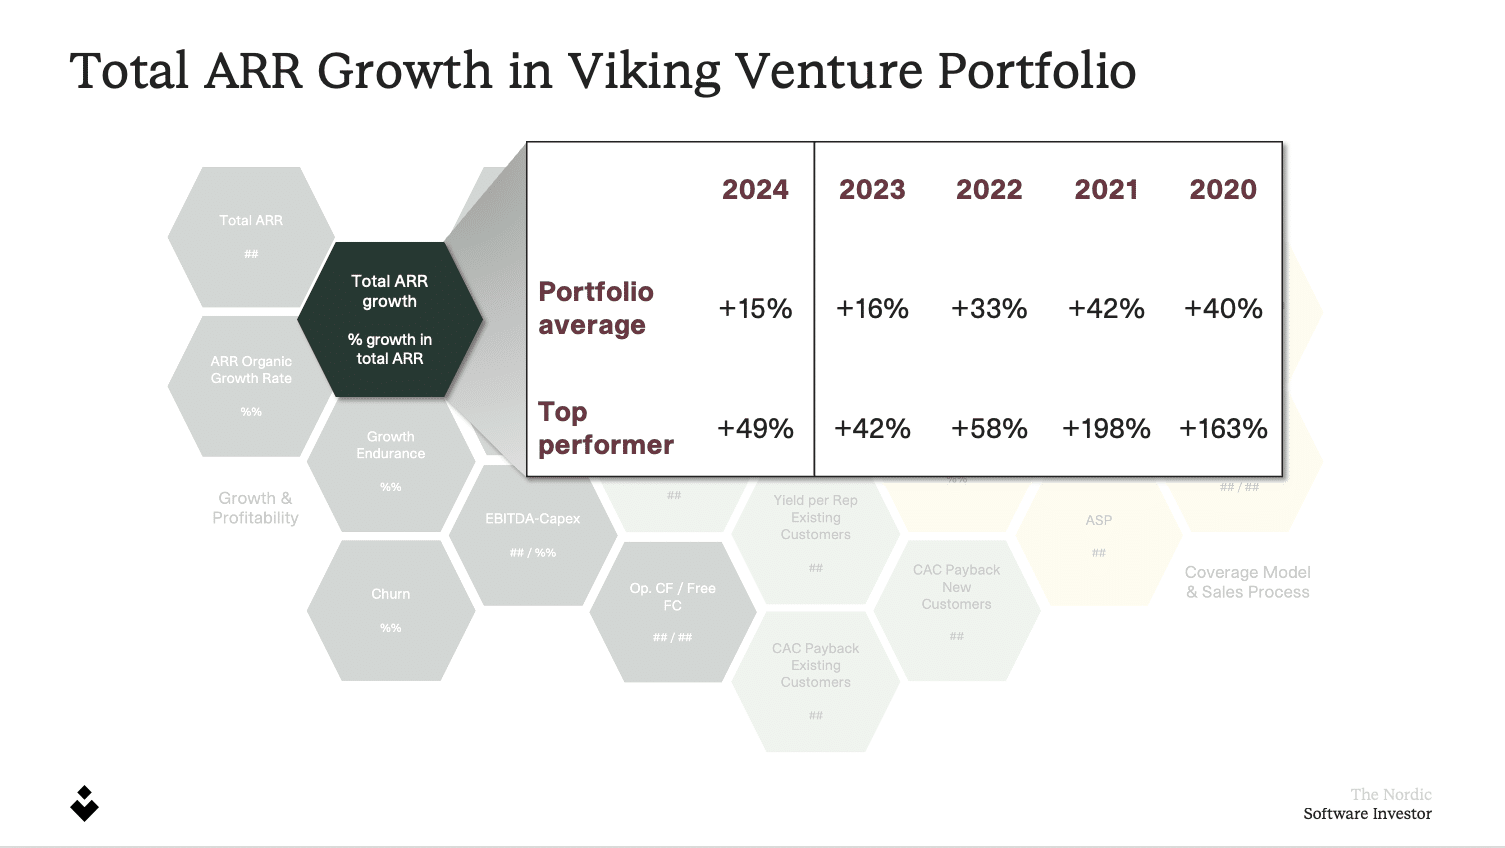
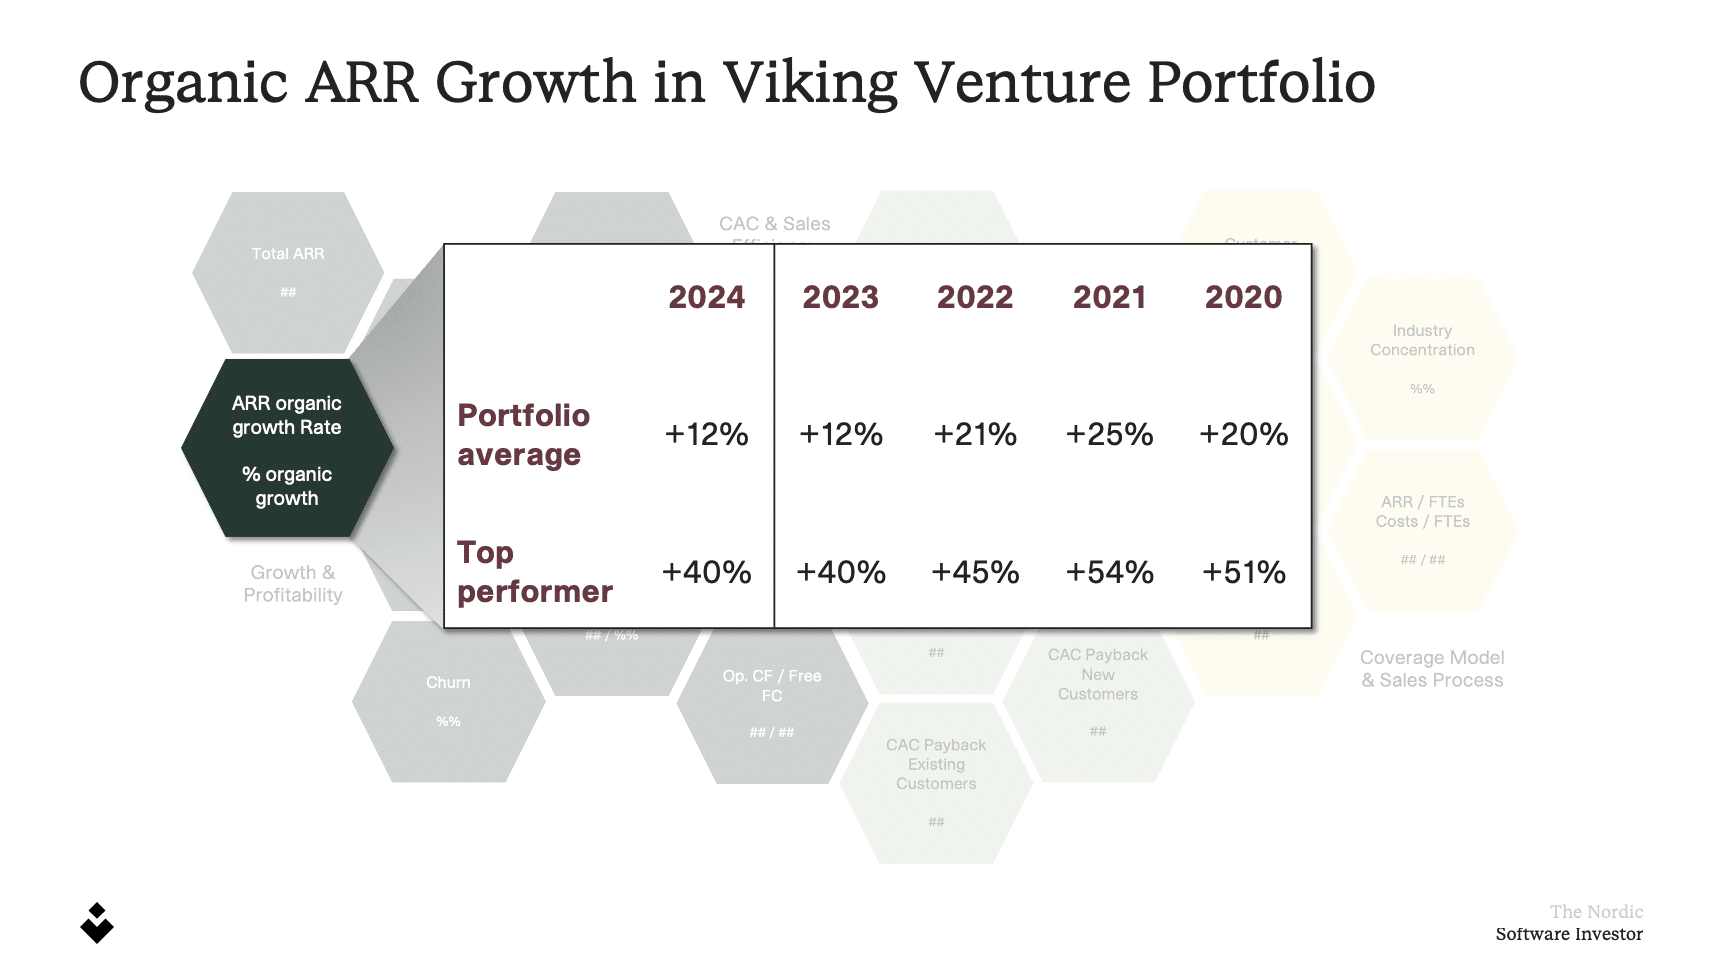
We find it very important to distinguish between organic and inorganic growth to understand the underlying drivers. The average of our portfolio’s total annual recurring revenue (ARR) growth in 2024 was 15%, which includes acquisitions. The average for organic growth was 12%, while our top performer grew by 40% organically.
In the following sections, we will review our Growth and Profitability KPIs. When looking at these KPIs, keep in mind the shift in valuation priorities—from a focus on ‘growth at all costs’ to a balanced approach emphasizing both growth and profitability. The ratio has evolved from 6:1 to 1:1 and now to 2:1, reflecting a renewed emphasis on sustainable growth.
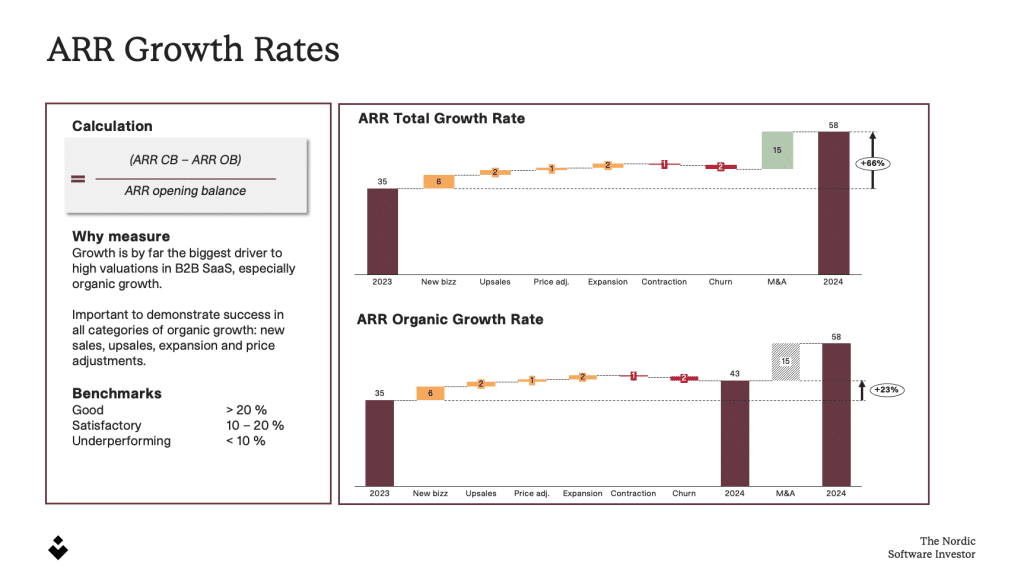
ARR Growth – the most significant value driver of B2B SaaS companies.
- Total ARR Growth, including acquisitions
- Organic ARR Growth, excluding the effect of acquisitions
- New sales ARR Growth, which only includes new sales
We are very fond of the ARR Waterfall model, which illustrates the ARR movements for new sales, up-sells, acquisitions, price increases, contraction, and churn. This overview gives us an understanding of how our companies leverage the different growth engines and how our top performing companies utilize all growth drivers. Check out our ARR Growth Report to see how this looks within the Viking Venture portfolio (coming soon).
Churn
You can measure churn in terms of ARR and # of customers; both are important to measure and track. Knowing your churn is essential for forecasting but understanding why customers cancel their subscriptions is the real value. We have run several projects with our portfolio companies to understand the root causes of churn and improve the value proposition.
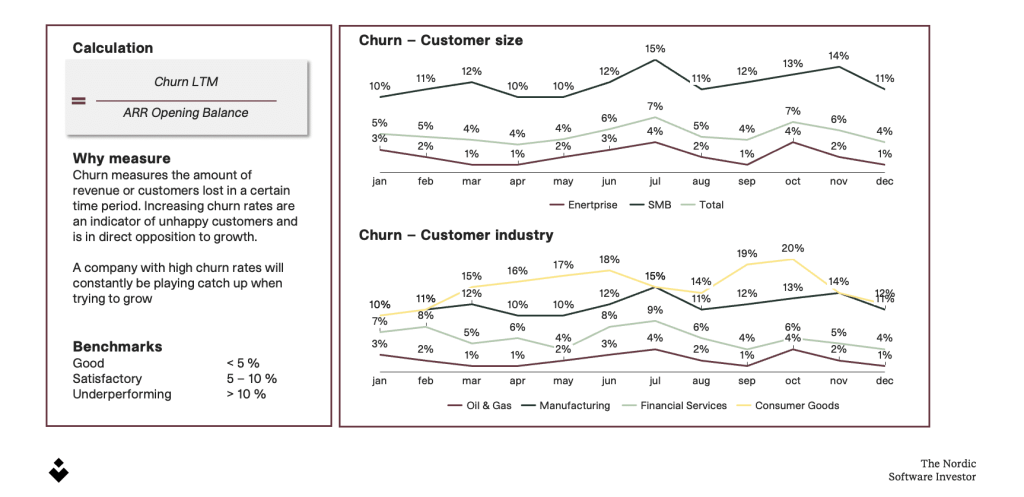
If you want to learn more about how to fight a high customer churn rate, look at our presentation on Six Initiatives To Keep Your Customers. You need to know your churn, but make sure you also understand your Renewal Rate.
Renewal Rate: why is this metric so important?
Churn might be artificially low if you include the total customer base rather than just the ones with contracts up for renewal. This especially applies to fast-growing companies or companies with customers on longer contracts. Many of your customers may be unable to churn even though they may wish to.
It is an excellent measure of customer satisfaction. It indicates healthy and profitable growth in the long term by telling us what percentage of our customer base actively chooses to renew their subscriptions when given a chance.
- Renewal rate can be measured in ARR and # of customers
- Only looks at those customers who are, in fact, able to churn
- The difference between retention and renewals:
- Retention = Measures the share of customers who continue their subscription, automatically or by choice
- Renewals = Customers who, by choice, renew their contracts when they can resign
- Segmentation is important to uncover the root cause of low renewal rate
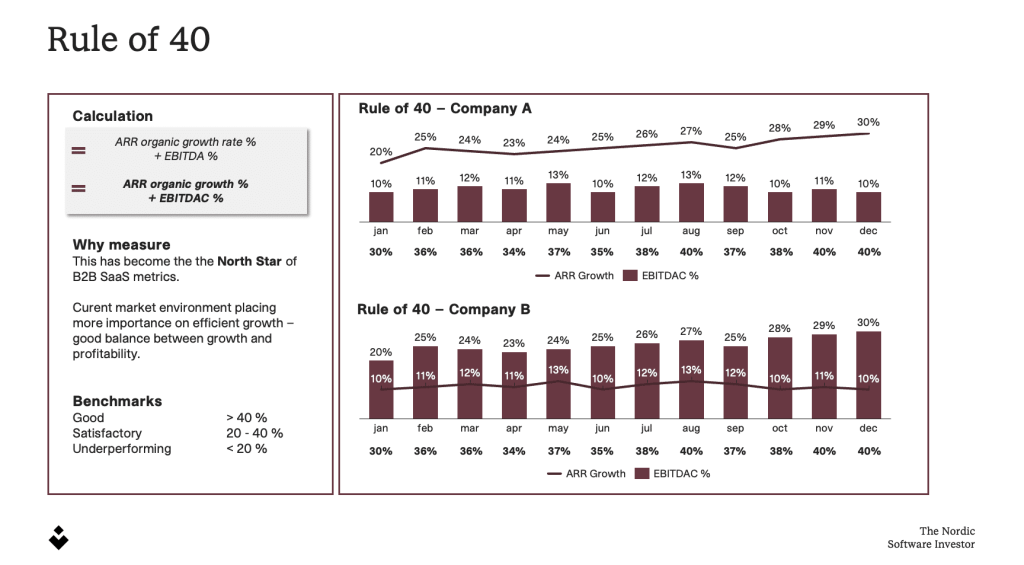
Rule of 40
As mentioned, the current market conditions have resulted in a shift where investors are no longer looking for companies with a growth-at-all-costs mentality. They would rather see a more balanced view of growth and profitability. It has also become apparent that choosing a clear profile, high growth, or high profitability is essential. You cannot waver in the middle.
Therefore, every business needs to understand the balance between growth and profitability. This KPI tells you whether you have found an optimal balance between growth and profitability. If the sum of your organic growth rate and EBITDAC margin is 40%, you have reached an optimal balance between growth and profitability. Let’s look at some examples:
- ARR organic growth is 40%, and EBITDAC margin is 0%
- ARR organic growth is 20%, and EBITDAC margin is 20%
- ARR organic growth is 10%, and EBITDAC margin is 30%
Within B2B SaaS, EBITDAC is widely accepted as a measure for Cash EBITDA, and more importance is being placed on this KPI as capitalization of R&D costs can vary greatly. Moreover, this is also why we differentiate between EBITDAC and EBITDA to ensure our companies don’t have an overstated view of profitability.
The Rule of 40 ensures our companies have a risk-adjusted growth profile, which helps us decide when to hit the accelerator and grab onto the brakes. Check out the article “Is the Rule of 40 an outdated SaaS KPI?” for a deeper walk-through of the Rule of 40
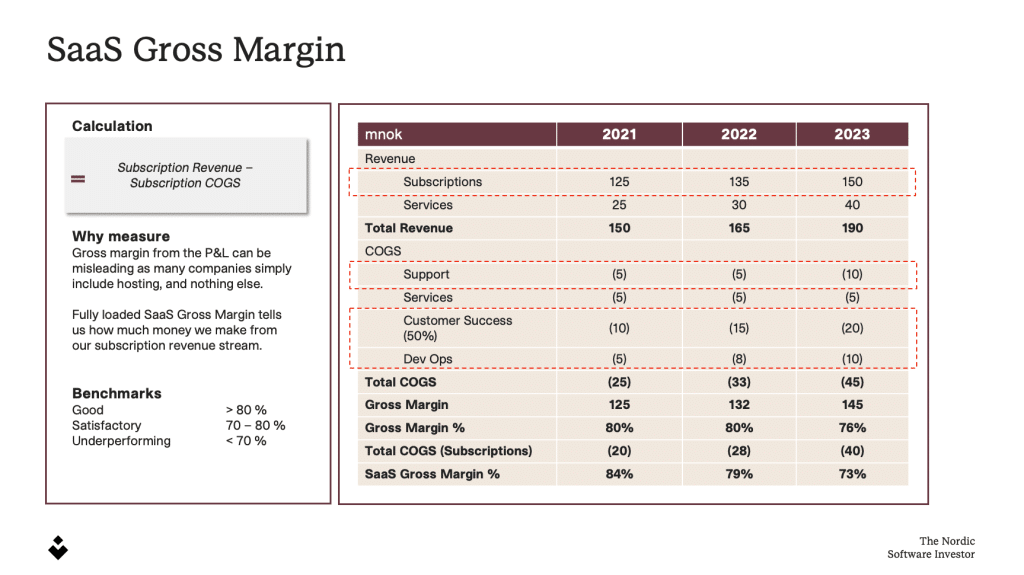
SaaS Gross Margin
SaaS Gross Margin = Revenue – SaaS COGS / Revenue
Why do we measure SaaS Gross Margin?
Traditional Gross Margin for software companies does not accurately show what the company retains of sales income after incurring all direct costs. Therefore, we need to adjust this to show SaaS Gross Margin. When broken down, this KPI helps a company understand its business’ scalability and can show which products/services contribute the most to the bottom line.
SaaS COGS = Cost of Goods Sold = All ‘variable costs’ attributed to delivery. These costs include all costs related to technical department and maintenance, which are the sum of both expensed and activated costs, third-party expenses, support, and other direct costs. You should also include costs attributed to the retention of current customers in the Customer Success department.
If you want to learn more about the KPIs for growth and profitability and how you can track progress, you can have a look at our previous article about 4 SaaS KPIs to improve growth and profitability.
2. SaaS KPIs for Customer Acquisition Cost (CAC) and Sales Efficiency
In the following section, we will go through our CAC and Sales Efficiency KPIs:
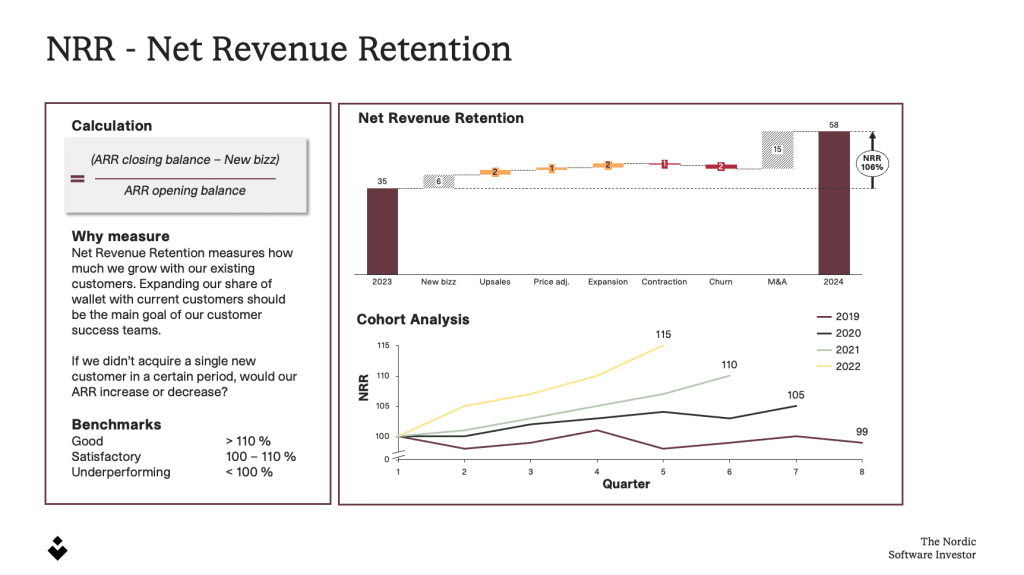
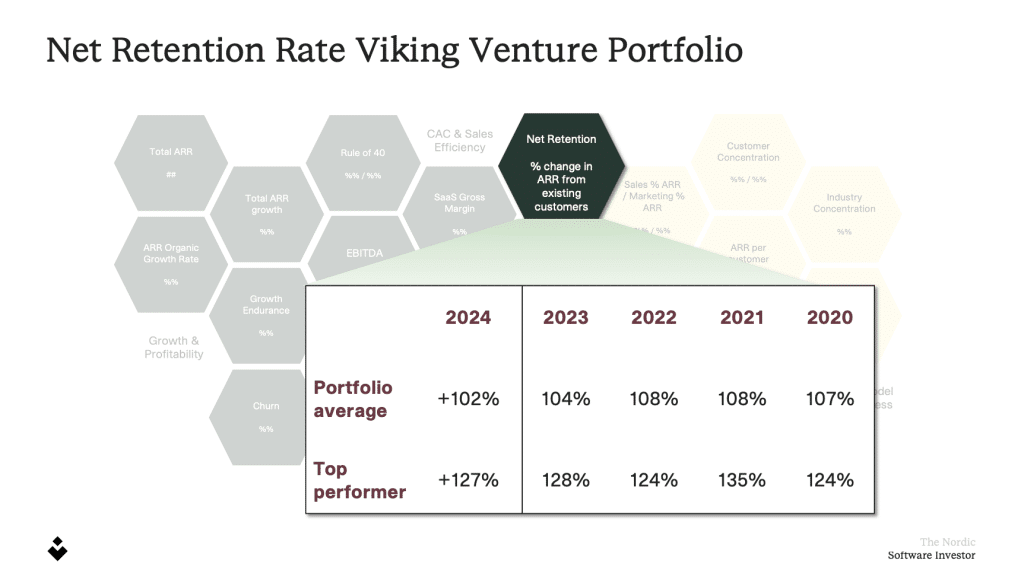
Net Retention
Net retention is known to be the most comprehensive metric as it tells the complete revenue story of the installed base of customers. This metric shows you what your company’s top-line revenue would be if you didn’t gain a new customer again. In other words, it captures the negative impact of lost customers and the positive impact of price changes, up-sells, and cross-sells.
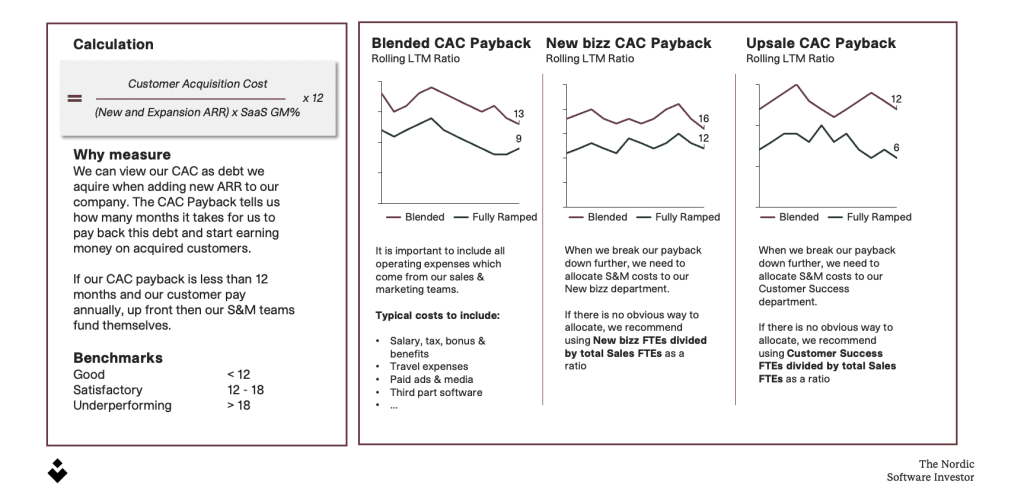
CAC Payback
We measure this because it is the primary KPI connected to sales scalability, and growth will require capital if the CAC payback is more than 12 months. When we segment this KPI based on customer type, we can focus our efforts on where we are the most effective.
- CAC encompasses all the sales and marketing costs that a business needs to spend to acquire a new customer and sell to existing customers
- Marketing, meeting bookers, sales costs (new sales & customer success)
- CAC payback tells us how many months it takes to recoup our customer acquisition costs
- For a more granular view, it is important to segment based on the type of customer and fully ramped/blended sales force
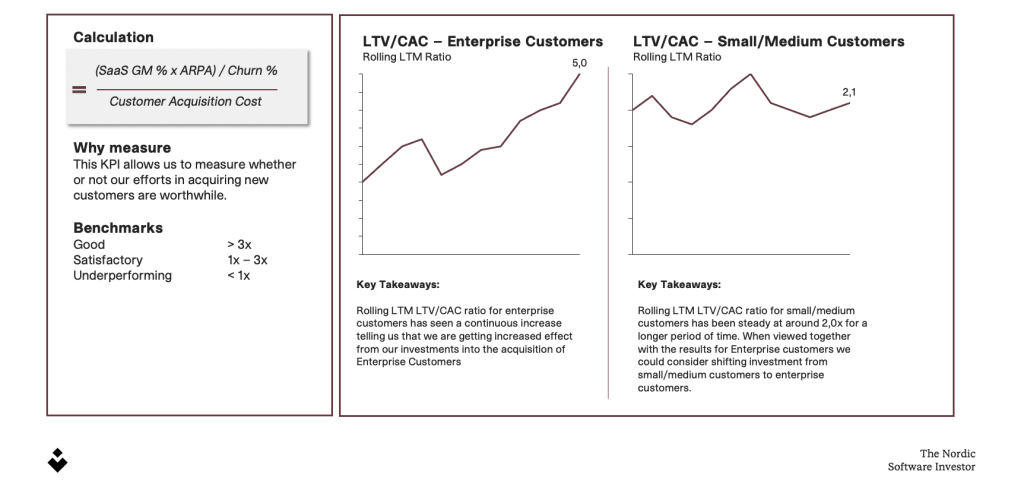
LTV/CAC
In addition to the customer acquisition cost, we want to look at the Lifetime Value (LTV). The reason for this is simple: the lifetime value of a customer must be higher than the cost of acquiring that customer.
3. SaaS KPIs for Coverage Model
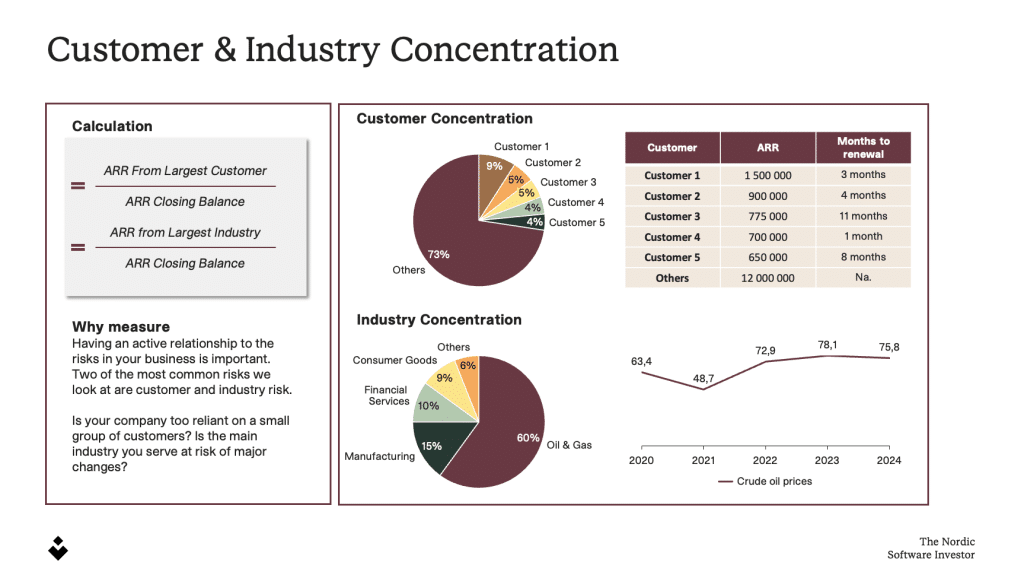
Customer and industry concentration
Customer concentration measures how total revenue is distributed among your customer base. High concentrations carry substantial risks for businesses. Losing a customer can devastate revenue, and customers have more influence on pricing and can divert a disproportionate share of resources.
When measuring this in the Viking Venture portfolio, we look at the ARR from the top 1 customer and top 10 customers of total ARR.
- Top 1 Customer = x %
- Top 10 Customers = y %
Keep in mind that some industries tend to have higher customer concentrations than others; for example, retail sales typically generate low concentrations, while industries with many enterprise players generate high concentrations.
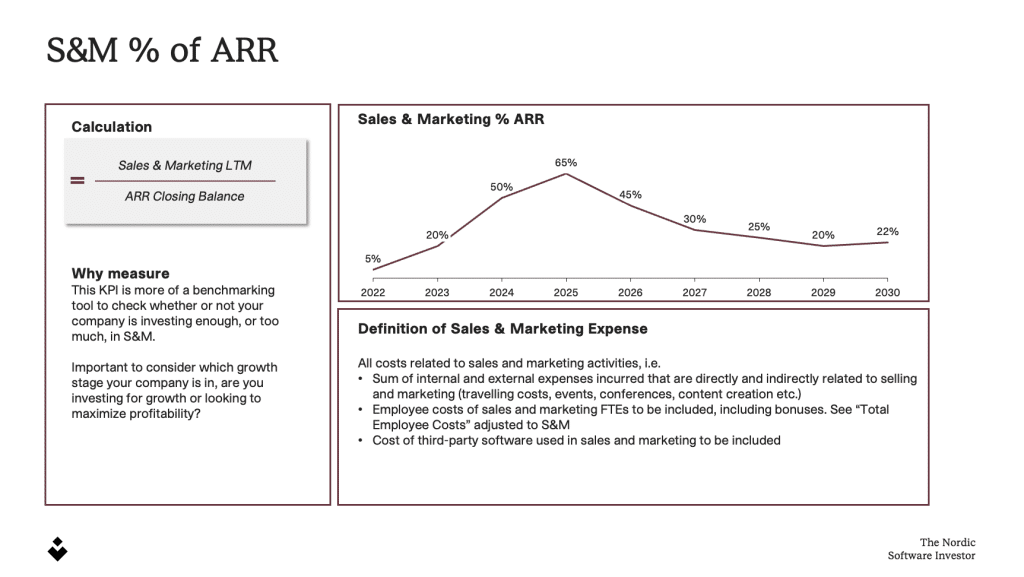
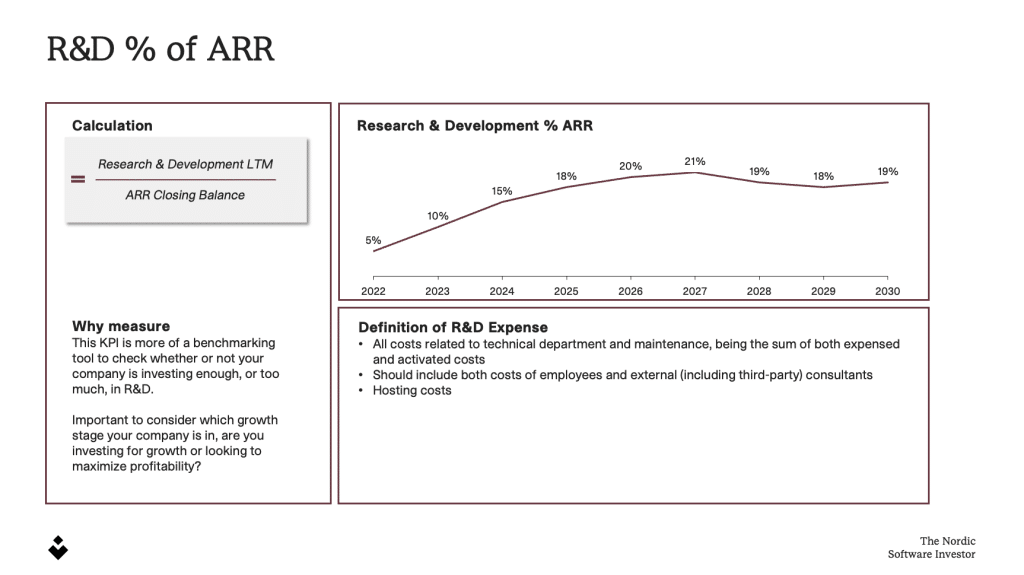
Sales & Marketing costs and Research & developing costs of total ARR
We measure this to understand how much our companies spend on product development and sales processes to continue growth. This KPI is especially interesting as a benchmarking exercise between the portfolio companies and up against the other KPIs we are measuring.
- Companies with high S&M costs % of ARR reinvest a significant portion of their profits back into sales and marketing as an investment in their continued growth.
- Companies with high R&D costs % of ARR reinvest a significant portion of their profits back into research and development as an investment in their continued growth.
According to Insight Partners’ Periodic Table, the benchmark for these two KPIs is approximately 30% based on performance data across their private and public SaaS companies. Insight Partners is one of the leading software investors in the world and share a lot of great knowledge on their website.
ARR / FTEs & Total Employee Cost / FTEs
How efficiently is your SaaS company growing? Tracking ARR per FTE and Total Employee Cost per FTE gives valuable insights into productivity and cost efficiency – how effectively are our companies working, and how do they compare to each other?
Applicable SaaS KPI benchmark for software companies
In this article, we have provided you with deeper insight into our Viking Venture KPI dashboard and how we use it to set the direction for our companies—in addition to getting great benchmarks for our B2B software companies. Hopefully, you have gained some valuable insight into how your company performed compared to the largest community of B2B SaaS companies in the Nordics.
Compare your performance to relevant benchmarks with our SaaS KPI Cheat Sheet here: