Have you ever wondered what the benchmark for ARR growth is for Nordic software companies, or how much money they spend on growth vs staying profitable? In this article we will explain why we are obsessed with tracking key software metrics and KPIs, and how we use the Viking Venture KPI Dashboard as a tool to facilitate important insight across our portfolio.
Written by: Ingvild Farstad, Community Manager, Viking Ventur
If you cannot measure it, you cannot improve it
Lord Kelvin
KPI tracking for software companies
Measuring key metrics is important for all companies, but traditional business metrics are not comprehensive enough for a software company. For these companies there are some specific key metrics that are important to understand where you’re heading to make sure you’re taking the measures needed to grow and optimize your software business.
This is why we have developed the Viking Venture Portfolio Dashboard. Our focus on fast-growing software scale-ups gives us the possibility to provide a KPI reporting solution for our companies where they can report key metrics and track their performances against each other. Each company has their own KPI Dashboard and access to highly relevant benchmarks across the portfolio. By getting this insight our companies can see what is working well and what needs to be improved in their own operations. They also see which companies are top performers in the portfolio and can reach out to understand what they are doing that works so well.
Learn about these key software metrics:
- Important SaaS KPIs related to growth and profitability and why you should measure them
- How to ensure a risk adjusted growth profile
- Insight into how you are performing compared to 16 other SaaS Scale-up companies in the Nordics
We divide our KPI Dashboard into three parts
- Growth and Profitability
- Customer Acquisition Cost and Sales Efficiency
- Coverage Model & Sales Process
This breakdown gives us a great way to understand our companies’ operations and make sure we don’t end up discussing sub optimal solutions. Below we tackle a selection of the KPIs related to growth and profitability.
Viking Venture KPI Dashboard: Growth and Profitability
ARR Growth
ARR Growth is the biggest value driver of B2B SaaS companies and there is a very strong correlation between ARR growth and valuation. Growth can be looked at in many ways. We believe it is important to distinguish between organic and inorganic growth to understand the underlying drivers:
- Total ARR Growth including acquisitions
- Organic ARR Growth excluding the effect of acquisitions
- New sales ARR Growth, which only includes new sales
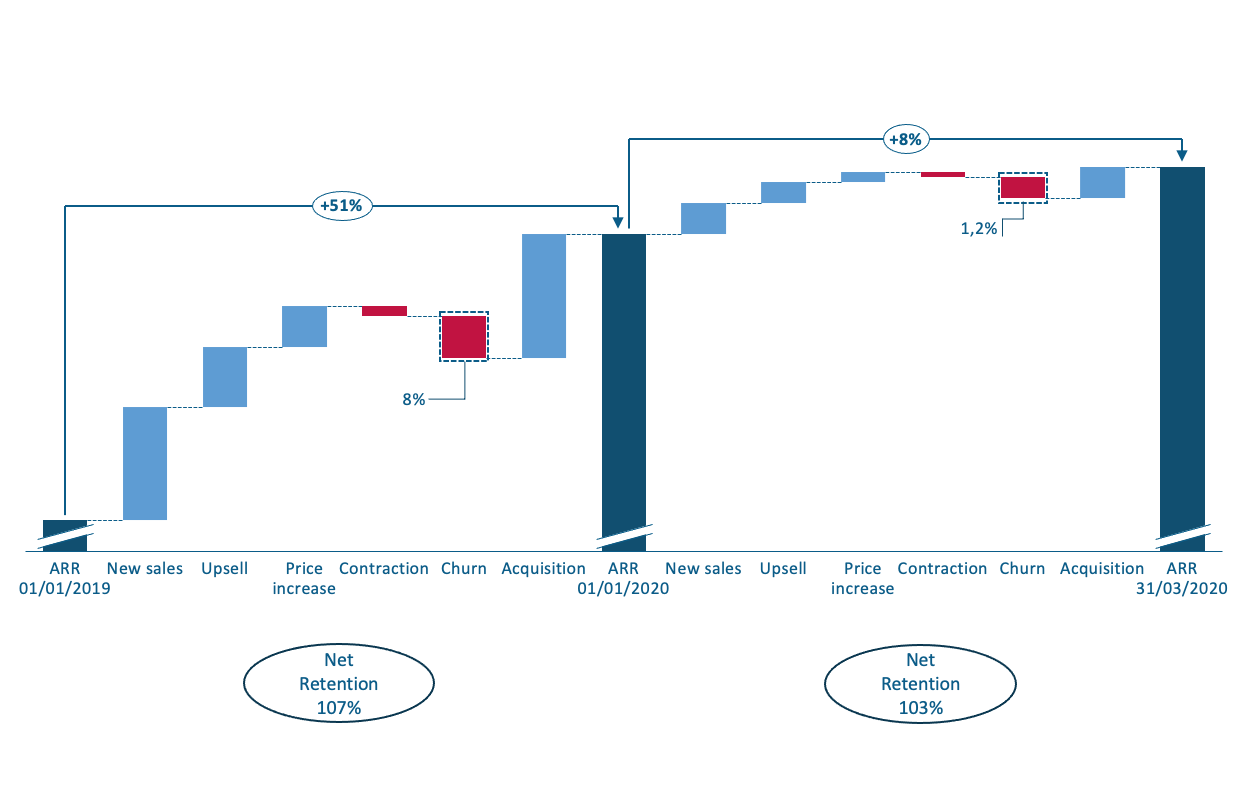
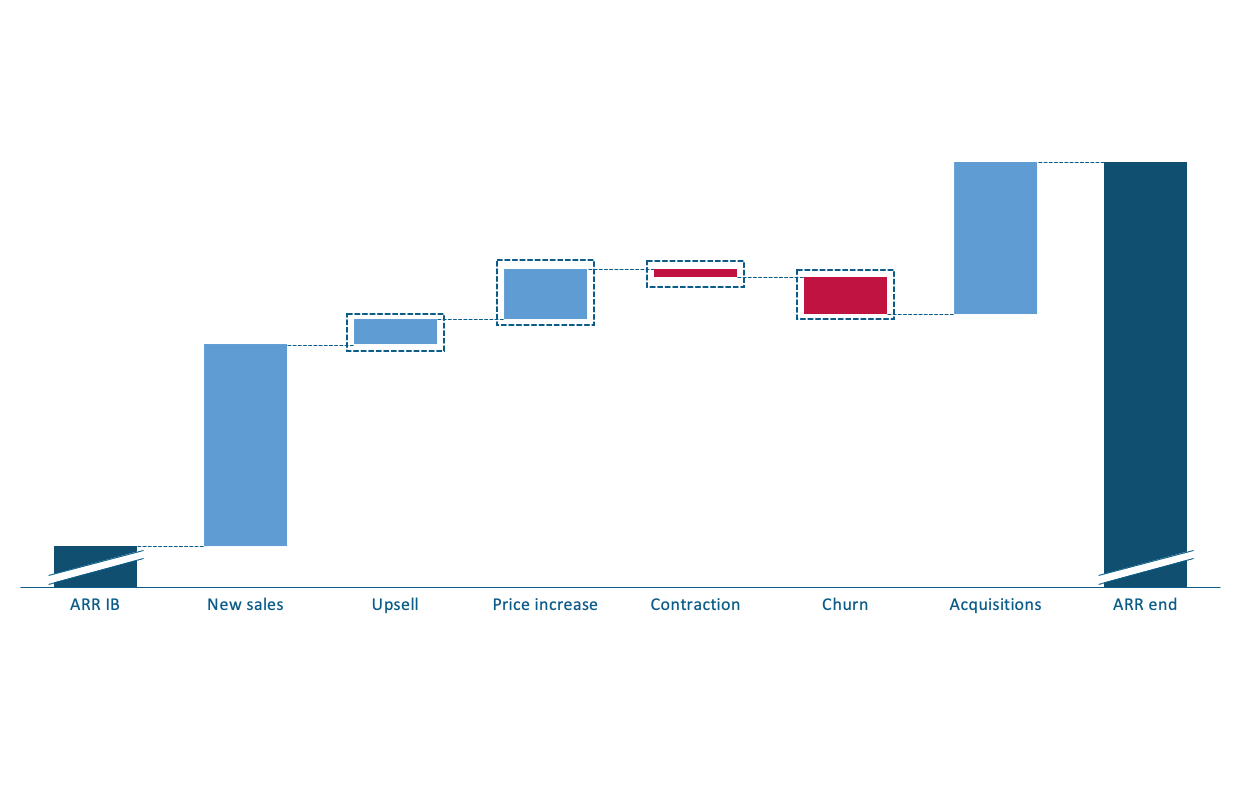
In addition to this, we are particularly fond of using the ARR Waterfall due to the simple but insightful way it illustrates the different ARR movements within a certain time period.

Net Retention
Net retention is known to be the most comprehensive churn metric as it tells the complete revenue story of the installed base of customers. What this means is that it shows you what your company’s top-line revenue would be if you didn’t gain another customer ever again. In other words, it captures the negative impact of lost customers, but also the positive impact of price changes, up-sells and cross-sells.

Churn
Churn can be measured in terms of ARR and # of customers and both are important to measure and track. Knowing your churn is important for forecasting, but the real value lies in understanding why customers choose to cancel their subscriptions. We have run several projects with our portfolio companies to understand the root causes of churn and improve the value proposition.
Want to learn more on how to fight churn? Take a loook at our presentation on Six Initiatives To Keep Your Customers
Renewal Rate

A great measure of customer satisfaction is Renewal Rate. It indicates healthy and profitable growth by telling us what percentage of our customer base actively choose to renew their subscriptions when given the chance.
Why is this key software metrics so important?
Churn might be artificially low if it is based on the total customer base. This especially applies to fast-growing companies or companies with customers on longer contracts. This is due to the fact that many of your customers might not be able to churn even though they may wish to.
Renewal rates can be measured in absolute terms (ARR) and # of customers. Both are valuable measures to track to fight churn.
Churn might be artificially low if it is based on the total customer base.
Rule of 40
There is a need in every business to understand the balance between growth and profitability. This KPI tells you whether or not you have managed to balance growth and profitability in a healthy way. It is widely accepted that if the sum of your organic growth rate and EBITDA margin is 40% you have reached an optimal balance between growth and profitability. Let’s look at some examples:
- ARR organic growth 40% and EBITDA margin 0%
- ARR organic growth 20% and EBITDA margin 20%
- ARR organic growth 10% and EBITDA margin 30%
We look at the rule of 40 to ensure our companies have a risk adjusted growth profile, which helps decide when to hit the accelerator and when to grab on to the brakes.
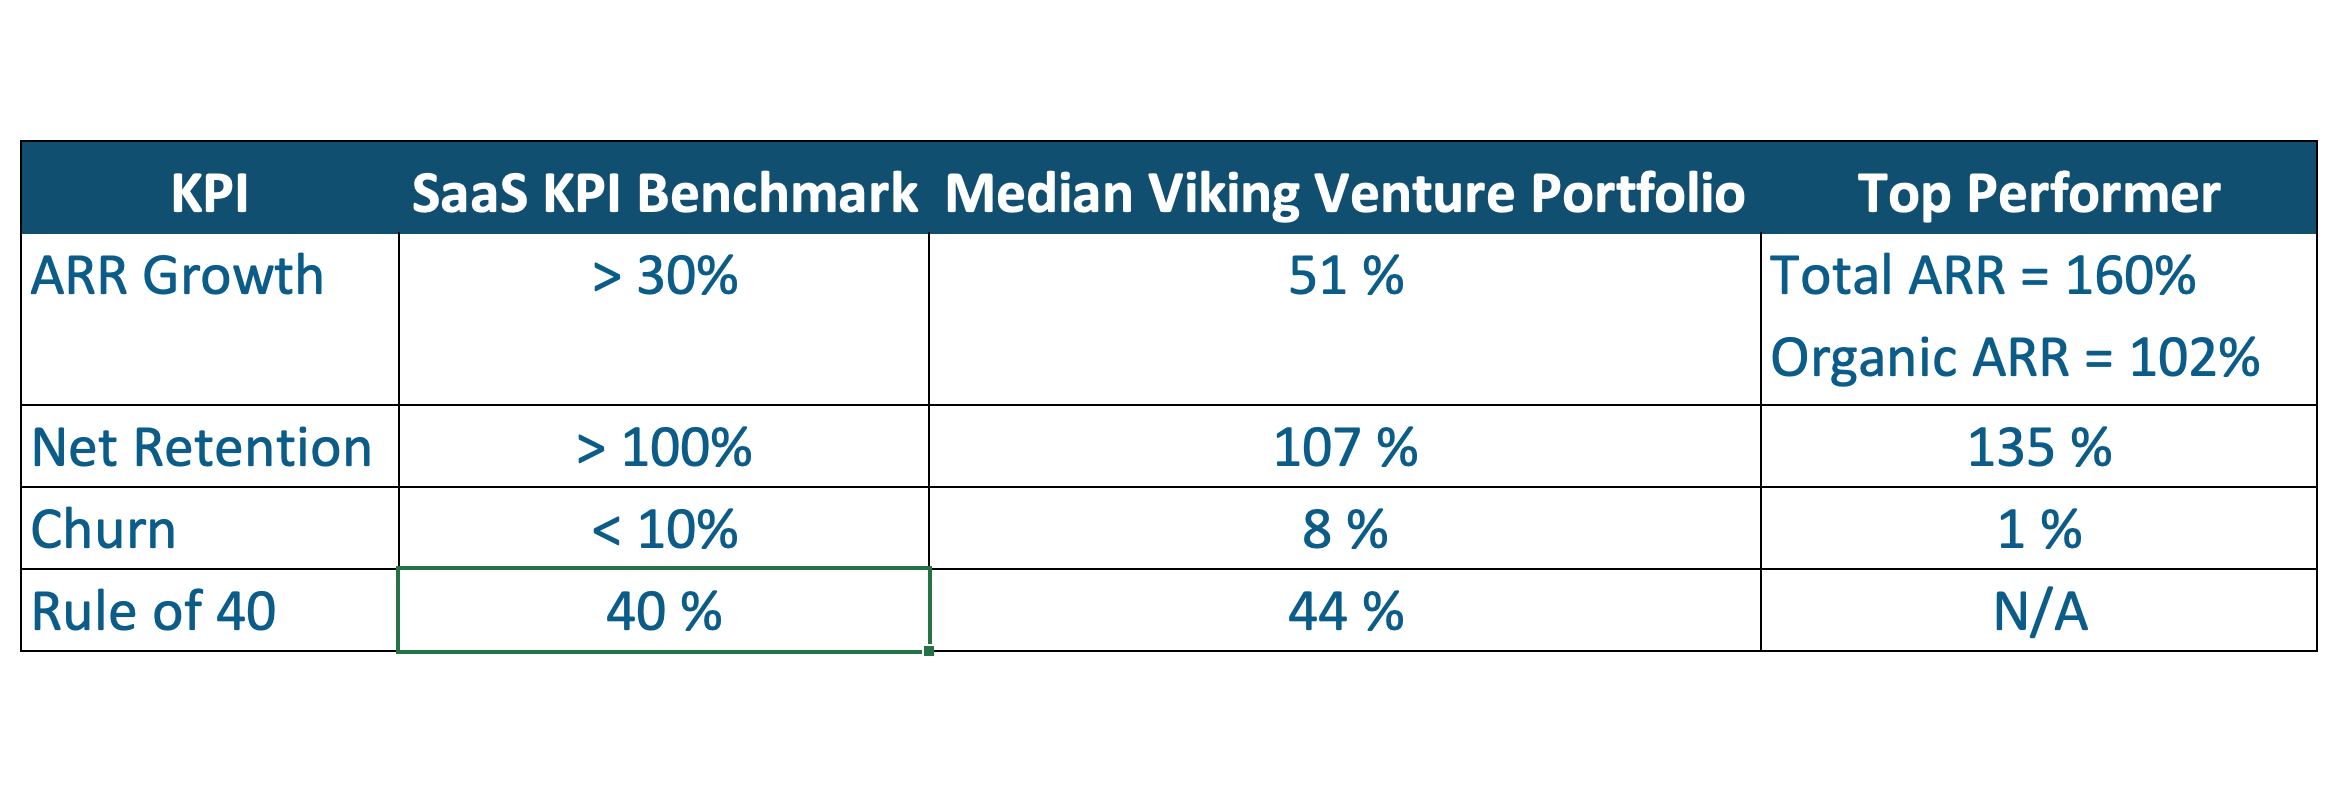
So how did our portfolio perform on the key software metrics in 2019
Our specialized focus on fast-growing software scale-ups has given us the possibility to provide a KPI reporting solution to our companies and track key SaaS metrics.
SaaS KPI Benchmark / Median Viking Venture Portfolio 2019

Learn more about key software metrics
Key performance indicators (KPIs) help you focus on what matters the most. This article reviews four essential SaaS KPIs for measuring growth and profitability. We look at total annual recurring revenue (ARR), organic ARR growth rate, churn, and the Rule of 40. We want to help you understand why these KPIs matter, how we measure them and how you can be a top performer of each KPI.