By Ingvild Farstad, Community and Marketing Manager, Viking Venture
In our last article about the Viking Venture KPI Dashboard we shared some thoughts on Why we are obsessed with tracking key software-as-a-service metrics and KPIs and how we use the dashboard as a tool to facilitate important insights across our portfolio.
This article looks at benchmark from the first six months of 2020 compared to the first six months of 2019. Keep in mind that the timing, seasonal variations and acquisitions can obscure the results when we only look at the first half of the year and not annualizing the numbers. We find this particular time period interesting due to Covid-19, also compared to the results of the 2020 KBMC Technology Group SaaS Survey – covid edition. A SaaS industry’s go-to benchmarking report, which reviews data from over 500 private SaaS company respondents.
Keep in mind that the timing, seasonal variations and acquisitions can obscure the results when we only look at the first half of the year.
Viking Venture invests in companies with software that supports their customer’s work processes. Covid-19 has been an acid test in stickiness and willingness to buy software during difficult times. We have reviewed and compared data from the first six months, January 1st through June 30th of 2019 with the same time period in 2020 and will share KPI benchmarks on ARR Growth, Net Retention and Rule of 40 across our portfolio.
ARR Growth
ARR Growth is the biggest value driver of B2B SaaS companies and there is a very strong correlation between ARR growth and valuation. We distinguish between organic and inorganic growth to understand the underlying drivers.
- Total ARR Growth including acquisitions
- Organic ARR Growth excluding the effect of acquisitions
- New sales ARR Growth, which only includes new sales
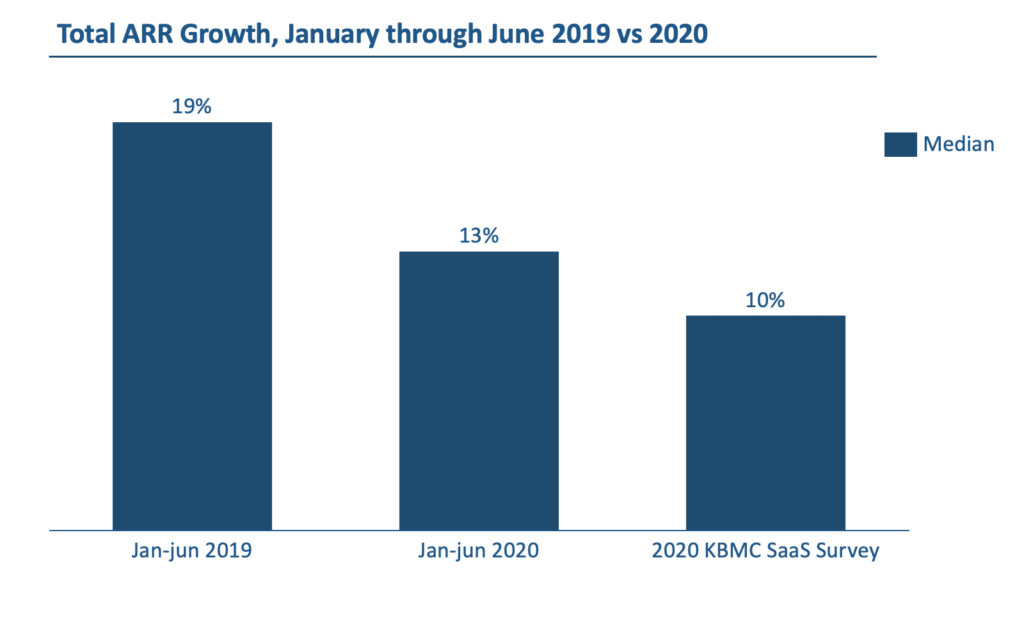
While one company had a higher Total ARR Growth rate during the first six months in 2020 compared to 2019, most of our companies experienced a drop. Looking at the numbers from 2019 vs 2020 we have seen a decrease in average Total ARR Growth from 25% to 16%. The median dropped from 19% to 15% in our portfolio, while the SaaS Survey reports 10% median among the respondents.
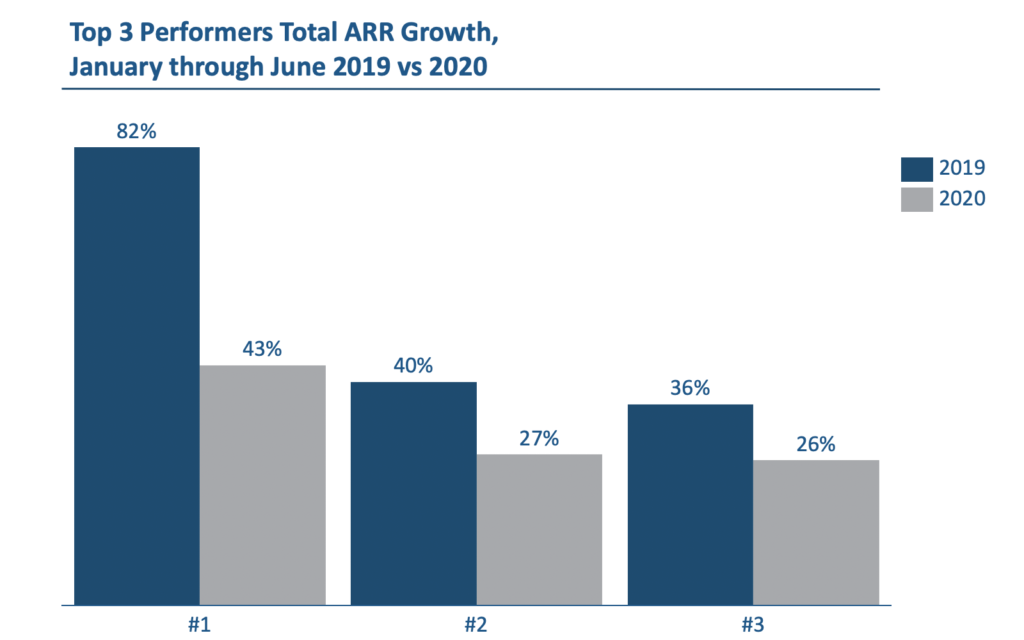
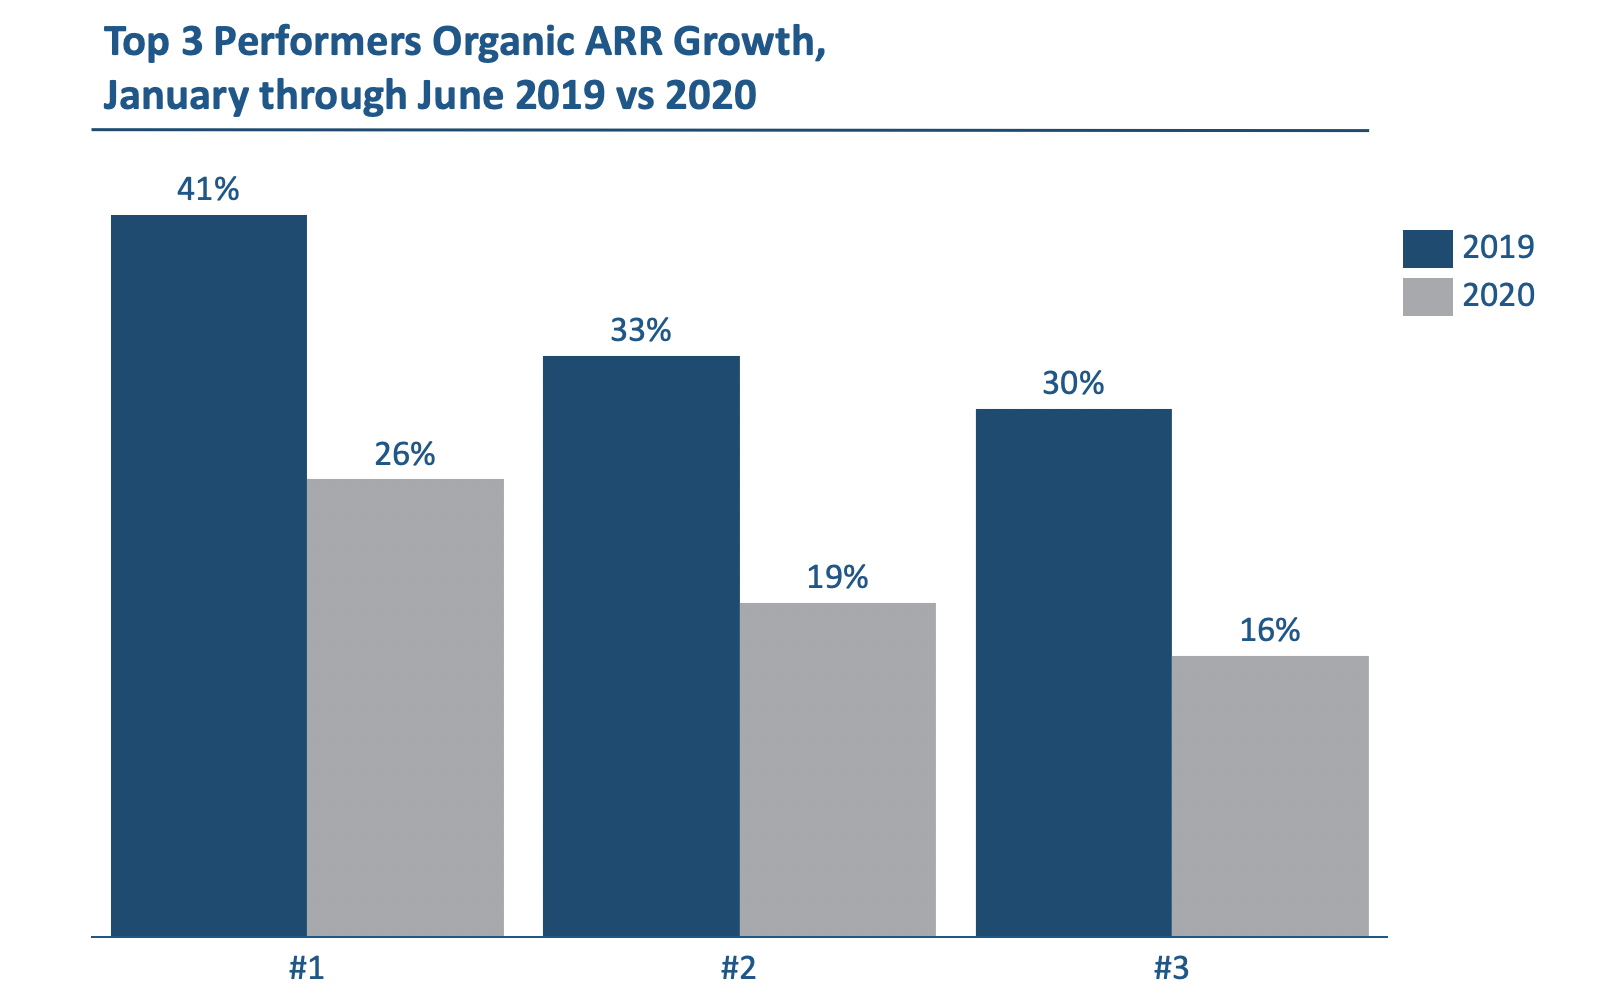
What about our top performers?
Even though we saw a decrease in growth the first half of 2020, our top performers continued to grow at a high pace.
Net Retention
Net retention tells the complete revenue story of the installed base of customers. It shows you what your company’s top-line revenue would be if you didn’t gain another customer ever again. In other words, it captures the negative impact of lost customers, but also the positive impact of price changes, up-sells and cross-sells.
During the first six months of 2020 average Net Retention dropped from 105 to 102 compared to 2019, but the Median Net Retention at 102 stayed the same both years. Only four companies were below 100 in the end of June, all of them above 90.
Rule of 40
It is crucial for businesses to understand the balance between growth and profitability. The optimal balance is if the sum of your organic ARR growth rate and EBITDA margin is 40%.
Both average and median Rule of 40 increased in 2020 compared to 2019. This is not coincidental as we have deliberately worked with our portfolio to make sure they are managing the balance between growth and profitability in a healthy way. This helps decide when to hit the accelerator and when to pump the brakes.
Rule of 40 was also one of the KPIs we highlighted last time and at SaaStock Remote a number of keynote speakers suggested the Rule of 40 should be the new north star for SaaS businesses.
Take a look here for our Quick-Fire Tips from SaaStock Remote on how to adapt, survive and thrive.
Click here for our key take-aways from the conference on how to adapt, survive and thrive
Feedback from our software companies
It has been a very different and difficult time due to Covid-19, but our companies have worked hard to adapt and thrive. The feedback from our portfolio companies during this time has been that it was harder to close deals and get companies to make buying decisions.
In summary they focused on
- Being a trusted advisor and working with existing and new customers without exploiting the situation. The main goal was to have a birds eye view and share knowledge from the market that could help the situation.
- Work on segmenting the market and focusing their efforts in the most effective ways
- Using the situation to get closer as a team and with other departments. This was a time for training and sharing success stories and best practice
- Build pipeline and take measures to ready the organization for when the market ‘opened’ again
This feedback resonates with the results from the 2020 KBMC SaaS Survey, which is the industry’s go-to benchmarking report, each year reviewing data from over 500 private SaaS company respondents.
Benchmark from over 500 private SaaS company respondents
Check out 2020 KBMC SaaS Survey if you want more benchmark from the software-as-a-service community. This year’s survey is redesigned due to Covid-19 and focuses on baseline performance for 2019 and 2020 year-to-date, through May 31st.
In our next piece we will share lessons learned on how one of our companies reshaped their sales function from field sales to inside sales and reached all-time high in June 2020. Stay tuned..
Learn more about the Viking Venture KPI Dashboard in this video
We help Nordic software companies scale. That’s all we do.
www.vikingventure.com
Ingvild Farstad, Community and Marketing Manager, Viking Venture
Ingvild manages Viking’s software community, which offers a unique environment for our portfolio companies to exchange knowledge, ideas and experiences within the most important processes for software companies.


